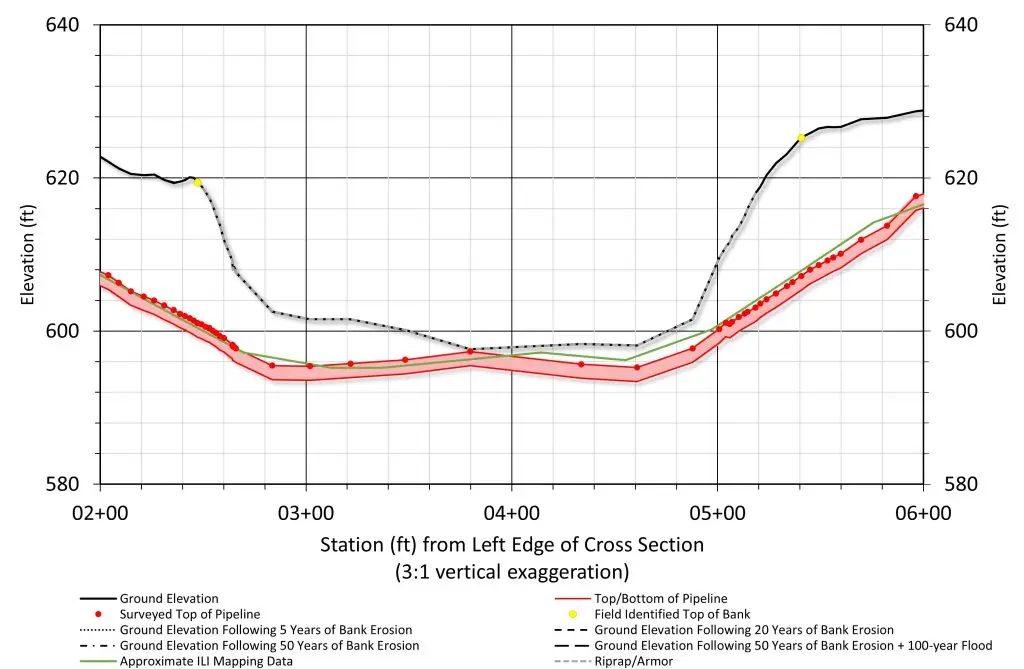
Site Stats
Survey Method
Kayak Single-Beam + Skipper NDT + Drone LiDAR
Current status
0.3 ft Depth of Cover (Under Armor)
Bank Risk
Failure Possible
Scour Potential
Low – Protected by Rip Rap
Pipeline Points
203 Depth Points + 110 Skipper Points
Photos taken
35 Photos Taken on Site
Drone DEM
805,650 ft2 Mapped Area
Collected Single-beam Lowrance Depth data
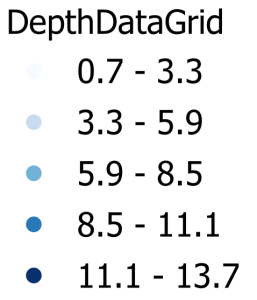
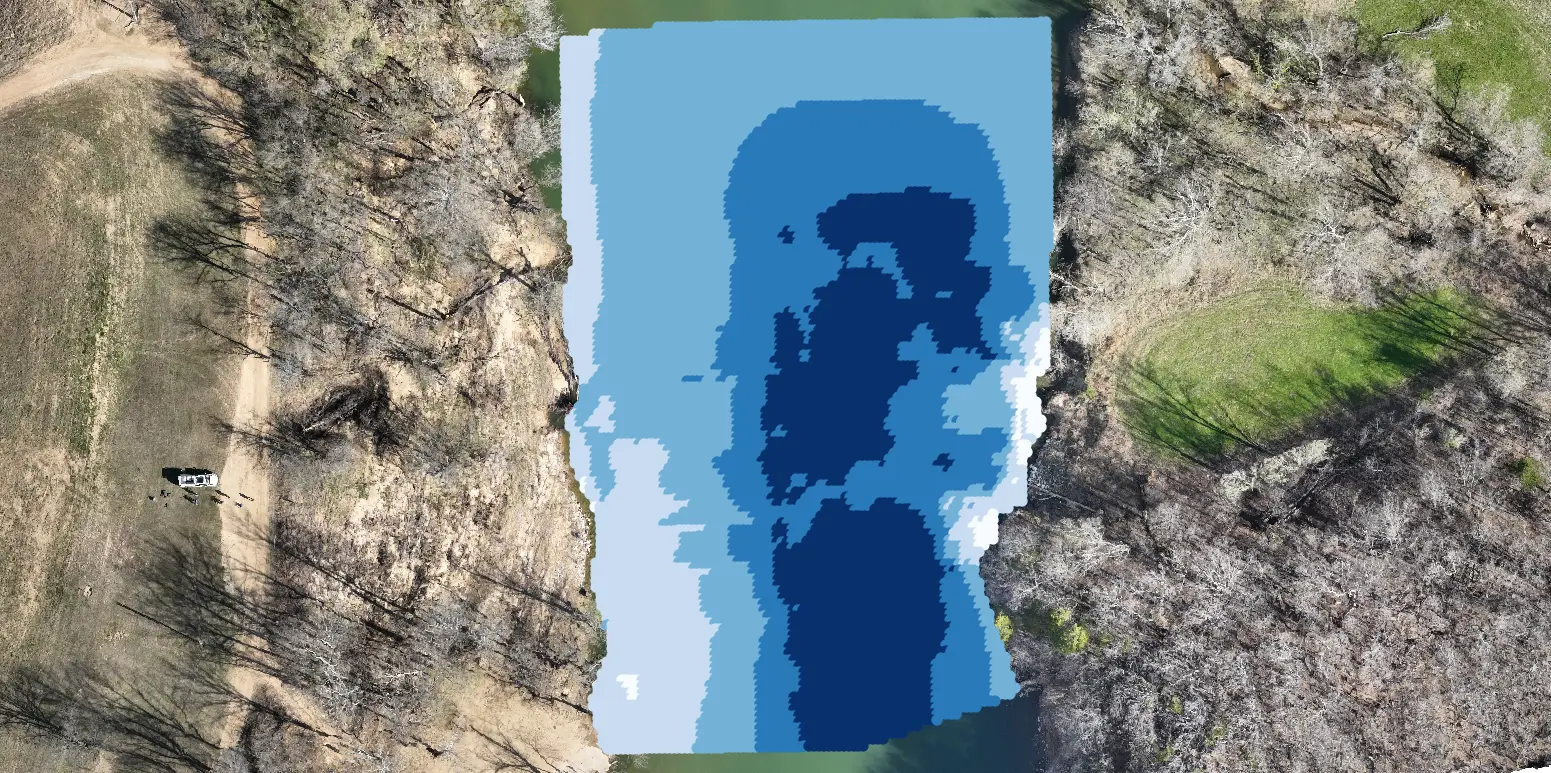
Explore the aerial Survey Data
To use the model:
- 360° Inspection:
- Rotate: Left-click and drag your mouse left or right to spin the model around the center point.
- Pan: Right-click and drag to move the camera laterally across the channel.
- Zoom: Scroll with your mouse wheel to inspect features closer.
- Dual-Mode Analysis:
- Aerial Imagery View: High-resolution photogrammetric overlay that reveals land cover, vegetation, and existing infrastructure.
- Topographic View: Elevation-based terrain modeling that quantifies depth, channel morphology, and slope gradients.
Legend:

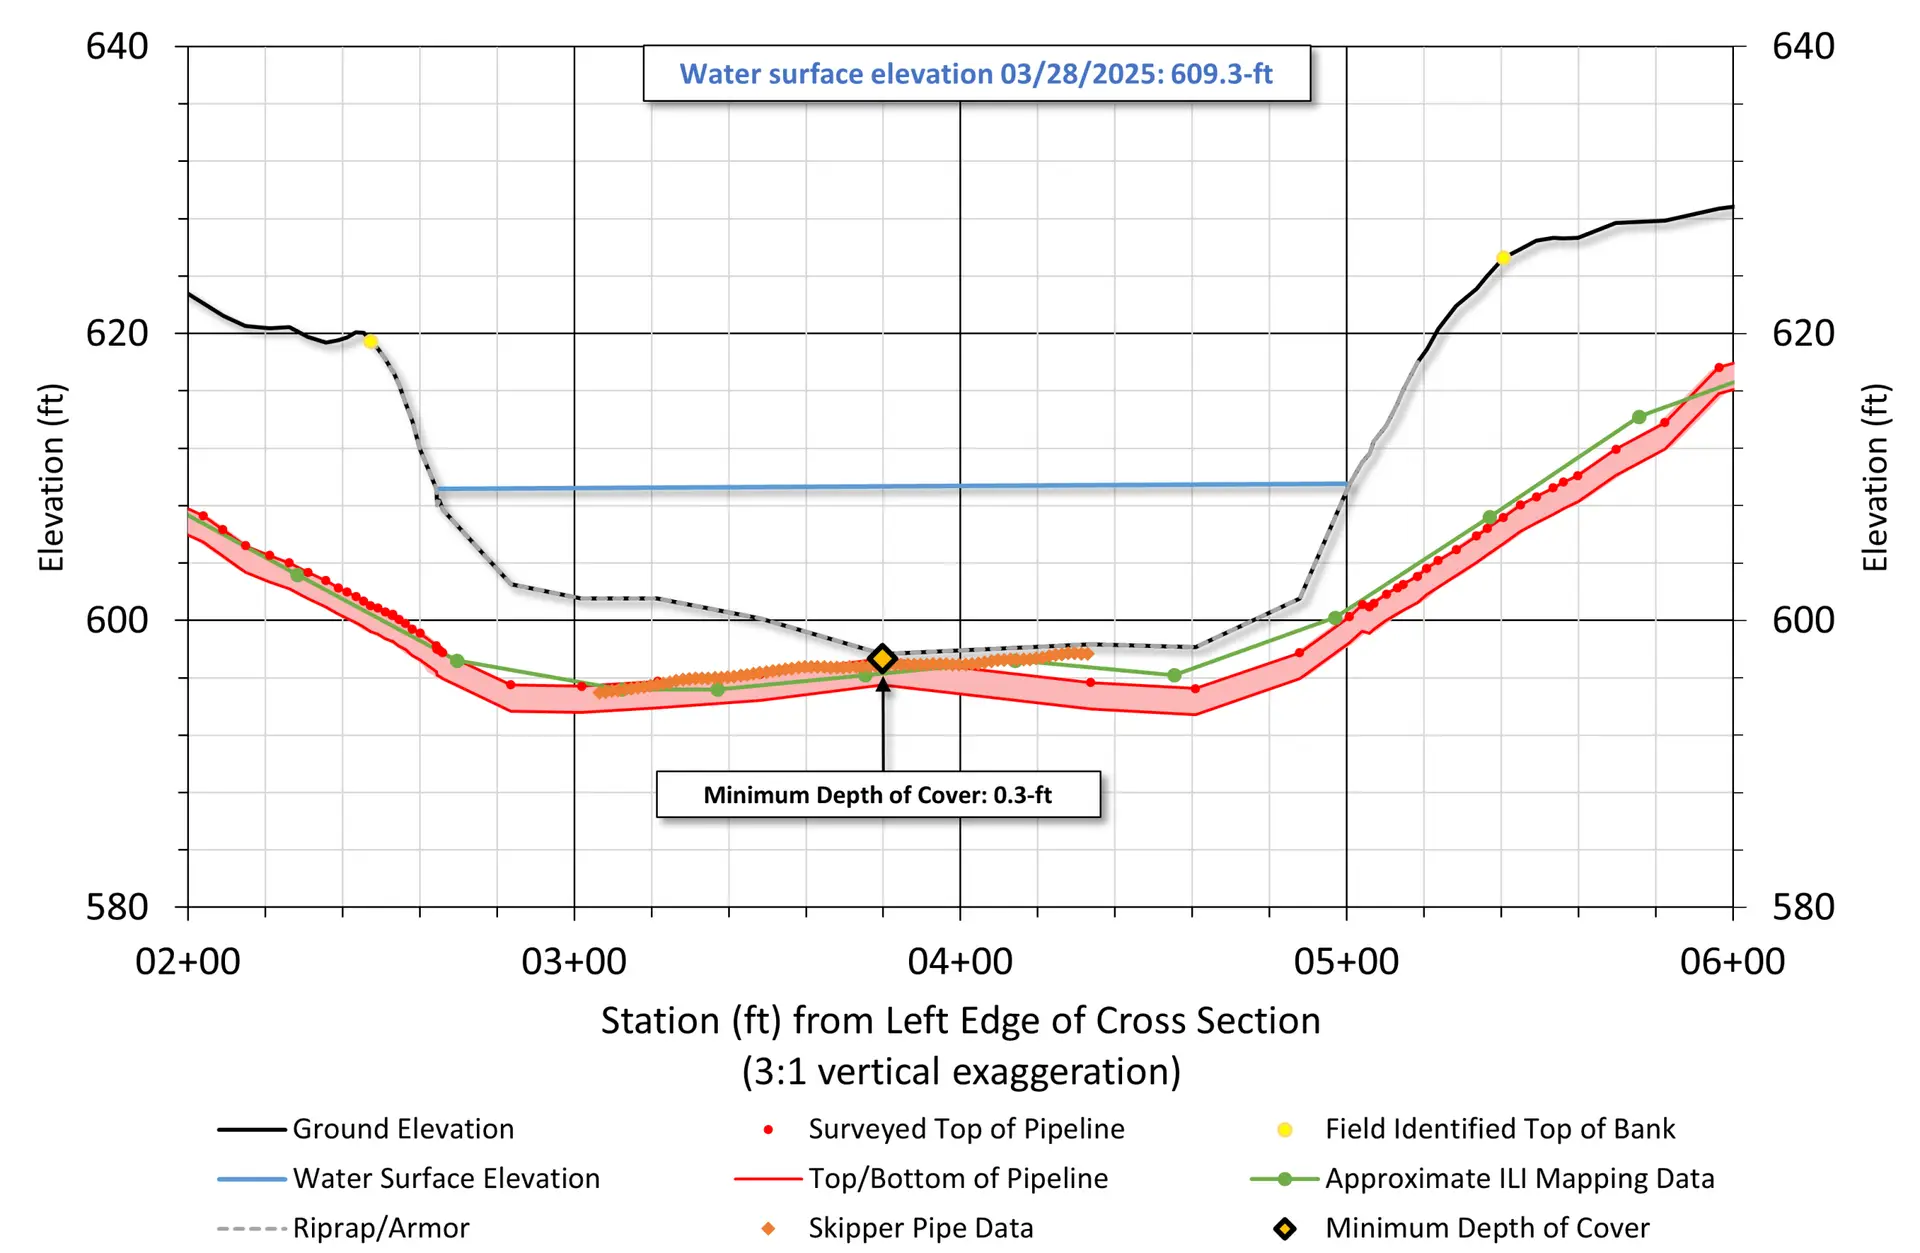
Skipper Depth Data
Pipeline Depth Data Points
Depth of Cover Profile
This cross-section illustrates the current bathymetric ground elevation (black line) relative to the surveyed top of pipeline (red points) and collected Skipper data (orange diamonds). The analysis identifies a localized area of concern within the main channel where the depth of cover reaches a minimum of 0.3 feet. While currently stabilized by riprap armor, this shallow cover necessitates continued monitoring of the bed’s geomorphic stability.
Scour Depths
Integration of bathymetric survey data and hydrodynamic modeling results in a ‘no-scour’ prediction for the Gasconade River at this location. This stability is attributed to the presence of riprap armor and favorable channel geometry, which effectively mitigate the risk of bed lowering during high-flow events.
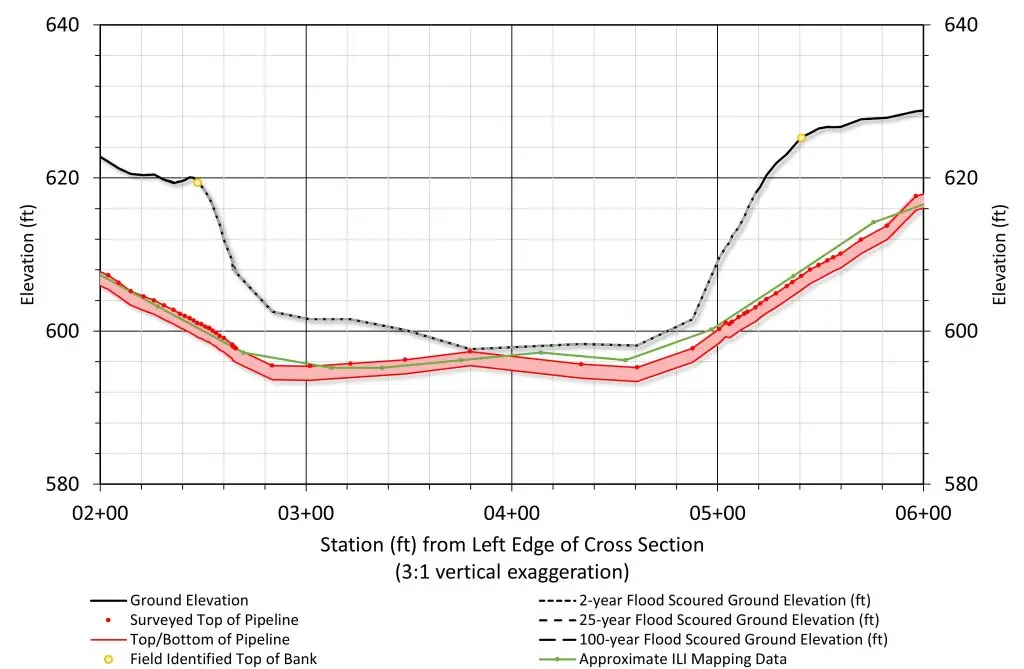
Scour Depths with large woody debris
Integration of field observations and hydraulic modeling confirms a ‘no-scour’ condition regarding Large Woody Debris at this site. While LWD is present in the reach, it is not currently positioned to concentrate flow or create turbulence capable of lowering the channel bed. We will continue to monitor the orientation and accumulation of debris during future surveys to ensure this stable condition persists.
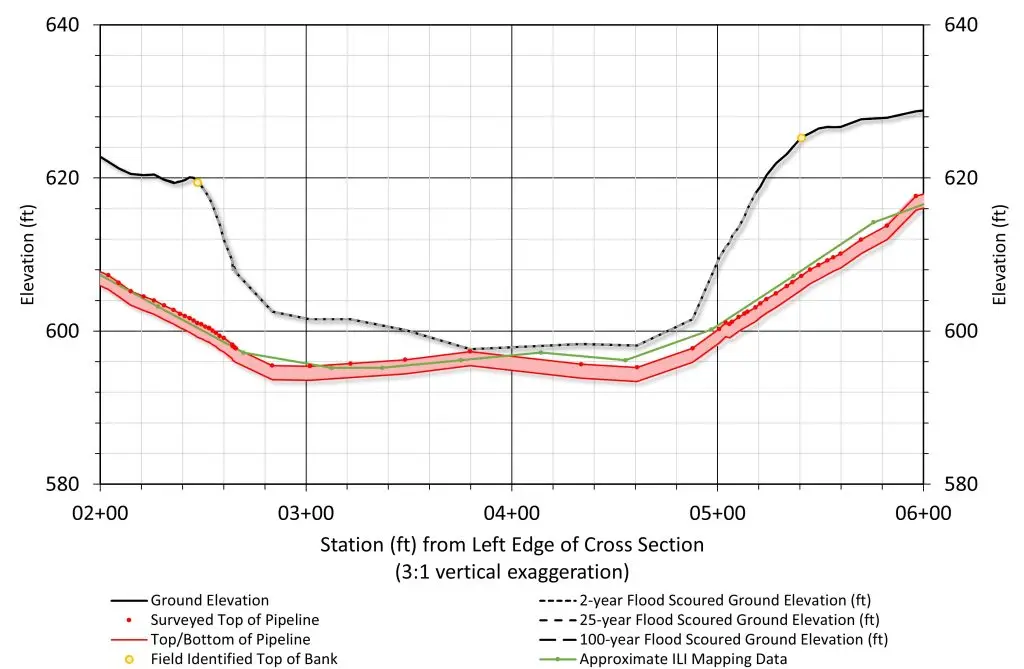
predicted bank migration
Integration of field observations and hydraulic modeling confirms a ‘no-scour’ condition regarding Large Woody Debris at this site. While LWD is present in the reach, it is not currently positioned to concentrate flow or create turbulence capable of lowering the channel bed. We will continue to monitor the orientation and accumulation of debris during future surveys to ensure this stable condition persists.